 Gamma Indicators
How to Read GammaOrderBook
A field guide to every element on the panel — Zero Gamma, session walls, BIAS score, OI status and the GEX Inactive flag — walked through live with a real PPI-day breakout on MES/MNQ.
What GammaOrderBook Is Actually Showing You
GammaOrderBook is a dealer-gamma-exposure (GEX) overlay. Using options open interest, it reconstructs roughly where market makers are net long or net short gamma at each strike, then converts that into price levels on your futures chart. Because market makers must hedge their books by trading the underlying, these levels behave like magnets and reflectors: price tends to gravitate toward large gamma concentrations and slow down or reverse near them — until something forces dealers to re-hedge in a hurry.
| Panel Element | What It Means |
|---|---|
| Zero Gamma (ZG) | The price where aggregate dealer gamma flips sign. Above it, dealers are typically long gamma and dampen volatility (range/pin behavior). Below it, dealers are typically short gamma and amplify moves (trend/chase behavior). |
| US / London / Asia walls | The largest gamma concentration built up during each trading session — literally the regions market makers "mark." These are the levels where hedging flow is heaviest and price is most likely to react. |
| BIAS score | A composite directional score blending gamma positioning, delta flow and volume. Rising BIAS = conviction building in one direction. |
| OI status | "Above / Balanced / Below" plus "Dealers Hedge Up/Down" — shows which way dealer hedging is currently leaning. |
| Δ (Gamma $B) | Aggregate notional dealer gamma exposure in billions — the "weight" behind the levels. |
| PRE/POST — GEX Inactive | A built-in warning: outside regular trading hours the tool flags its own signal as unreliable, because pre/post-market hedging flow is too thin to trust. |
| Target / Stop boxes | Suggested trade-management levels tied to the next gamma wall in the direction of the move. |
The Operating Rules
These are the rules that actually make GEX-based trading work in practice — confirmed against a live PPI-reaction trade below.
1. The walls are a probable map, not a promise
They're probability zones built from options positioning. That's why the tool prints a BIAS score instead of a signal claiming certainty.
2. Distance is covered by catalysts, not by GEX alone
On a quiet day, price can sit near a wall for hours. What makes it actually travel is a catalyst hitting the tape — usually a scheduled data release.
3. Read GEX together with the economic calendar
Scheduled releases (CPI, PPI, NFP, FOMC, retail sales…) are the only catalysts with a known date and time. Tariffs, geopolitics and war headlines have no calendar — you can't plan around them, only react.
4. Trade the session, not the pre-market
The panel literally says "PRE/POST — GEX Inactive" outside regular hours. Wait for that flag to clear and let the opening shake-out finish before trusting BIAS.
5. A big surprise can redraw the whole map
A large data surprise doesn't just push price through a level — it forces dealers to re-hedge in bulk, which can relocate Zero Gamma and the walls themselves to new prices. Re-read the structure after any high-impact release; don't just watch for a touch.
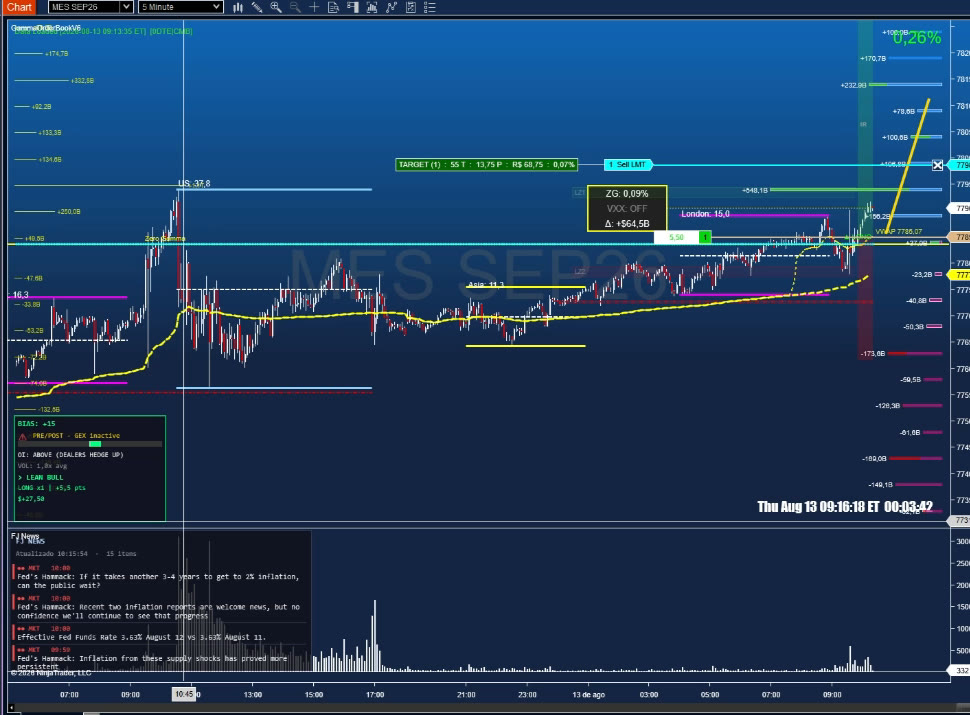
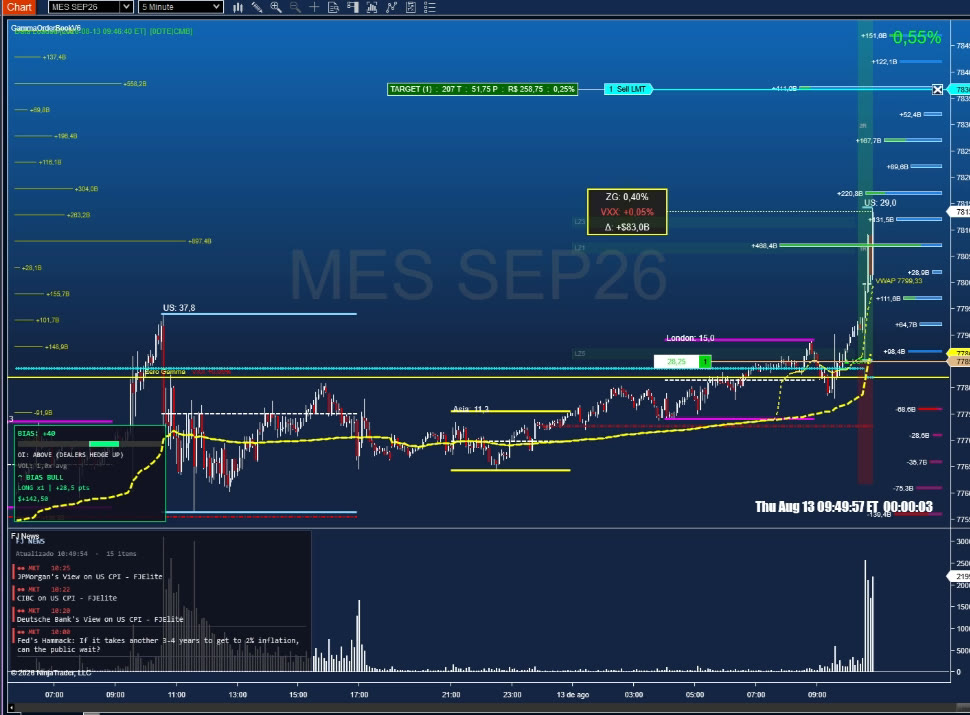
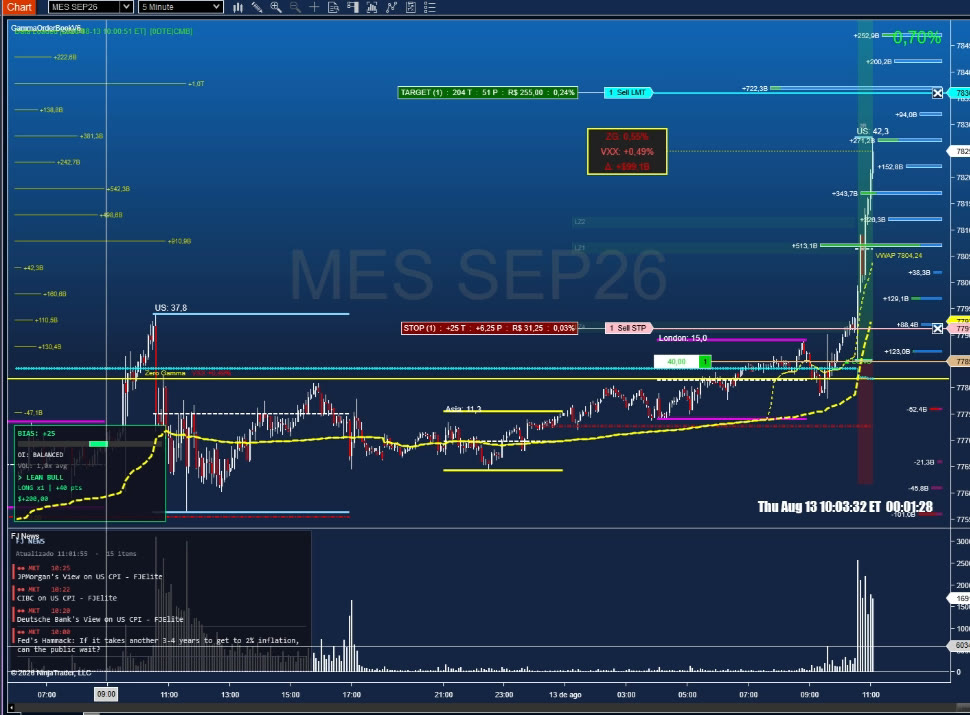
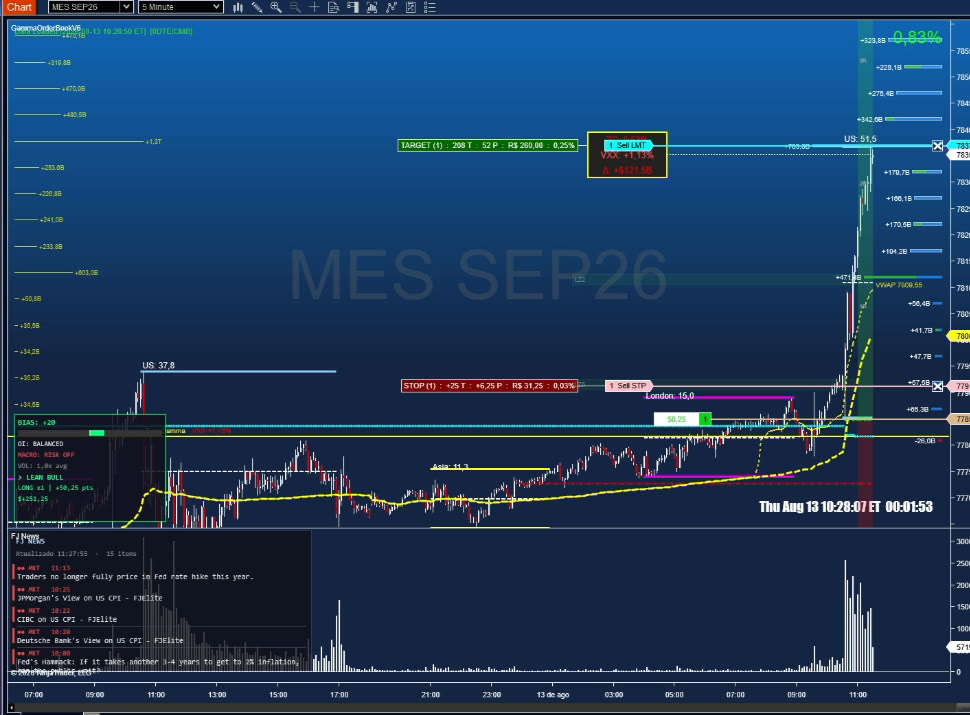
Case Study — Thursday, August 13, 2026
A real MES / MNQ session where every rule above played out in sequence, from pre-market to a confirmed trend extension.
U.S. Producer Price Index — July 2026 report, released Aug 13, 2026, 8:30 ET
Quick-Reference Checklist
Do
- Read US / London / Asia walls as the probable map for the session.
- Check the economic calendar every morning — the only dated triggers.
- Wait for "GEX Inactive" to clear and the opening shake-out to finish.
- Re-read the walls after any high-impact data surprise.
- Size risk for un-datable headline news (tariffs, geopolitics, war).
Don't
- Trade BIAS during the "PRE/POST — GEX Inactive" window.
- Assume a wall is a guarantee price will reach it that day.
- Ignore the calendar and trade the walls in isolation.
- Keep trading the old map after a major surprise print.
Sources & Further Watching
📄 Data & Reporting
🎥 More Real Trade Walkthroughs
This case study came from a live screen recording. For more real-session breakdowns using GammaOrderBook — payroll days, CPI days, FOMC days — see the indicator's YouTube channel:
Want this whole guide offline? Download the PDF (English / Português / Español).
Ready to read your own chart this way?
Start your 30-day free trial — just enter your email in the indicator properties and the system activates automatically.